Get Started with Fairwinds Insights (Free Tier), Kubernetes Governance Platform
Fairwinds Insights is software for Kubernetes platform engineers to integrate into internal developer platforms with built-in and customized Kubernetes best practices that improves DevEx.
It proactively monitors, identifies, and prioritizes recommendations based on best practices for your Kubernetes clusters and containers. Insights is now available for free for environments up to 20 nodes, two clusters, and one repo. Some people like to jump right in, while others like to walk through what to expect in advance. This post does exactly that, so read on to learn how to get started with Fairwinds Insights.
If you want to see what Insights looks like, check out our sandbox environment. You don’t need to sign up for anything to experience the platform. If you do set up a Fairwinds Insights free tier, we’ll provide you guidance along the way to help you understand what to do next — right in the application!
How to get started with Fairwinds Insights
In just seven minutes, you can get started with Fairwinds Insights! It’s a straightforward platform with a simple graphical user interface (GUI) that’s easy to navigate and intuitive for platform engineers, developers, and other Kubernetes users.
You can use your own cluster or set up a test cluster to get started for yourself. In the example below, we set up a test GKE cluster.
Step 1: Register an account
First step is signing up for Fairwinds Insights. This takes less than a minute. Simply visit the Sign Up page, enter your email address, and create (and confirm) a secure password. You’ll also need to enter a Captcha.
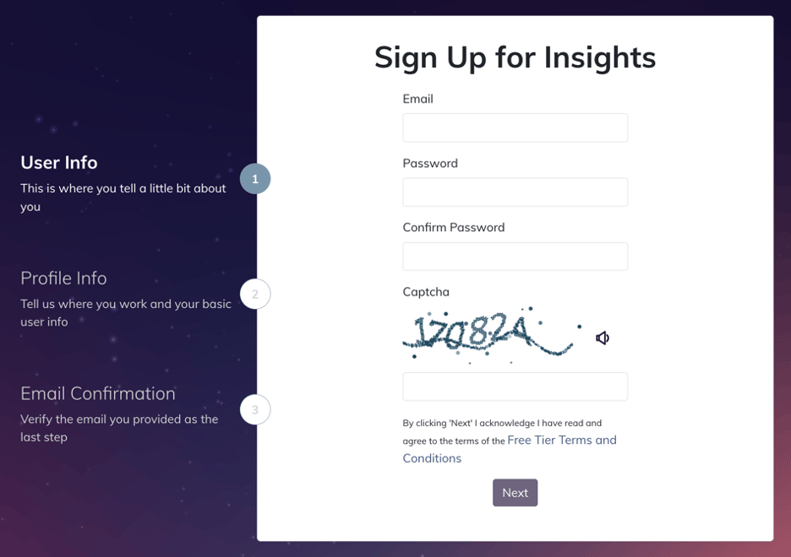
On the next page, simply enter your first and last name and let us know how you heard about Fairwinds Insights. Click next and within a few minutes (maybe less), you’ll get an email to confirm your email address.

Step 2: Create a new organization
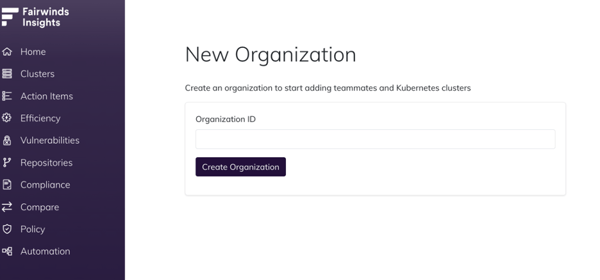
This step also takes less than a minute. You can ask your organization owner to add you as a member to an organization or you can create a new organization. Let’s assume you’re creating a new organization. You can enter your company name or create a test account. (Note: you cannot change your organization name later, so pick something that you’ll be happy to use going forward). Your organization’s name is all lower case with no spaces, but you can include numbers and dashes to separate words. Then just click Create Organization to move to the next step.
Step 3: Create a cluster
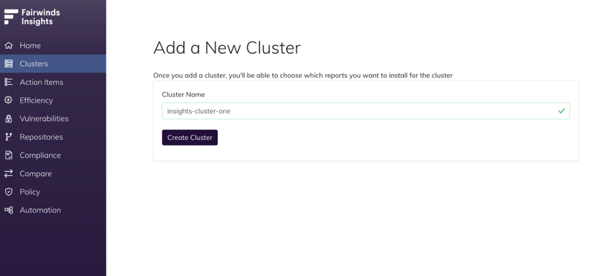
Next you need to add a new cluster. This is quick too! And once you add a cluster you can choose which reports you want to install for the cluster. By default, you’ll start with Polaris, Nova, OPA, and Pluto.
Step 4: Install with Helm
Time to install the agent! We’ve suggested some values in the screenshot below. These suggestions are based on Kubernetes best practices and we think they’ll make your life easier. You can customize this yaml file later to include more reports, available in the Install Hub. In the Insights platform, it’s easy to copy and paste this code into whichever editor you prefer and save it.

Next, install the Helm chart with these values (also simple to copy/paste):

Not using Helm? Here’s a guide to installing Helm.
Step 5: Check out the Fairwinds Insights Cluster Overview
Once you install the Insights agent, the screen will refresh and redirect you to the Cluster Overview. Depending on the size of your cluster, it only takes a few minutes to start seeing your reports.
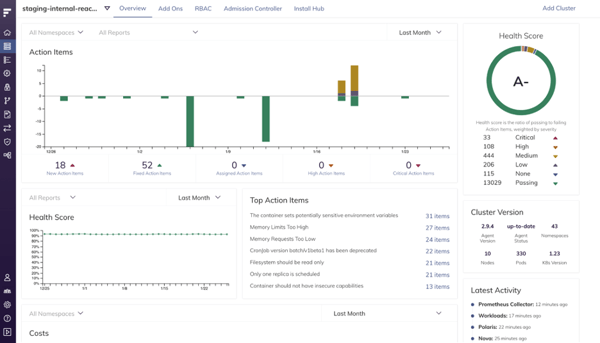
The Cluster Overview highlights action items identified by the reports running in your cluster, and how they impact your cluster’s overall health. You can quickly see your health score and how many critical and high alerts you have. Selecting Action Items from within Cluster Overview brings you to a filtered view in the Action Items nav.
Action Items
Click on Action Items to view issues found in your clusters. At the top of the page, you can filter by cluster and see the distribution of action items by severity and frequency in namespaces and workloads.
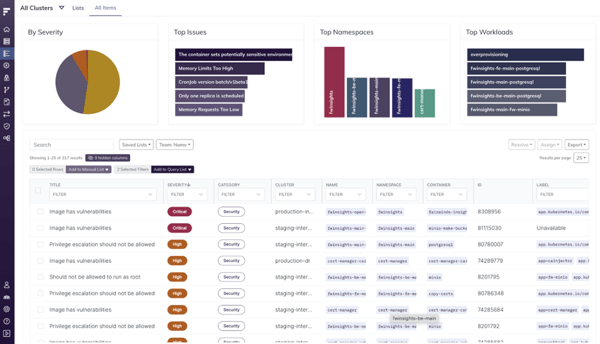
Insights allows you to search through your action items, filter them by title, severity (Low, Medium, High, Critical), category (Efficiency, Reliability, Security), cluster, name, namespace, and container.
Remediate an Action Item
Find an action item you want to remediate. Just click on the issue to see a description of the problem and information on how to remediate it.
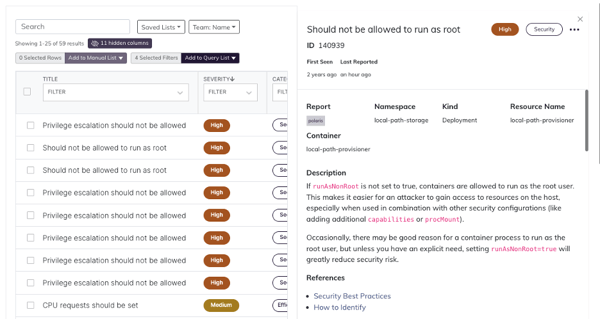
If you click on the three dots next to the category (in this example, it’s a Security issue), you have access to a menu that allows you to:
-
Create Ticket (Insights has integrations with Slack, Datadog, PagerDuty, Jira, and Azure DevOps - you’ll need to click on Manage Integration Settings to install them and create a ticket)
-
Resolve the issue (None, Working as intended, Won’t fix)
-
Snooze the action item (1 Day, 1 Week, 1 Month)
-
Assign it to a team member (if you are part of a larger organization, you’ll see your team members in this list)
-
See Similar Items
If you want more action items, go to Install Hub in the top navigation and add more checks.
Install Hub
When you’re ready, you can return to the Install Hub within the Cluster nav to add additional reporting, such as usage metrics and the identification of container vulnerabilities. Simply use the tiles to add or remove reports from the Insights Agent. You can also change the report’s configuration by clicking on a tile. Once you have selected the reports you want to use, click on Ready to Install in the top right corner of the page. You’ll get a Helm command to install the Agent with your new settings.
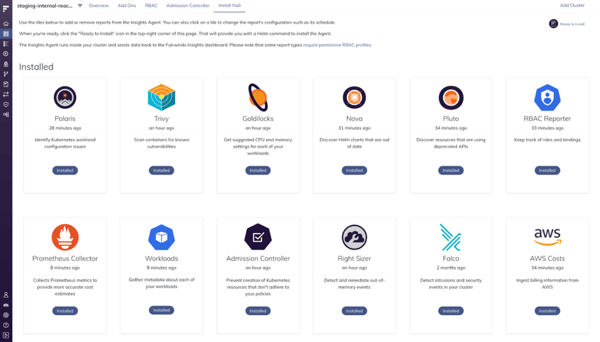
Some of the available reports include:
-
Trivy - scan your containers for known vulnerabilities
-
RBAC Reporter - keep track of roles and bindings
-
Kube-hunter - hunt for security weaknesses inside your cluster
-
Prometheus Collector - collects metrics to provide more accurate cost estimates
-
AWS Costs - ingest billing information from your AWS Cost and Usage Report
Notify with Integrations
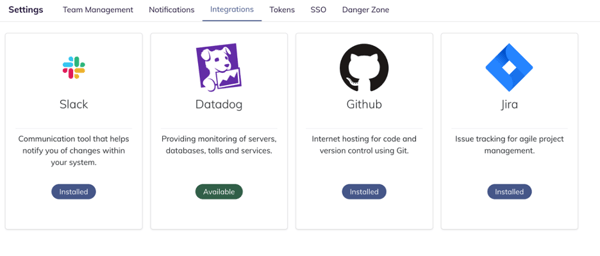
Empower teams to take action by sharing issues in tools they already use. Visit Settings to explore available integrations with providers such as Slack, Jira, and PagerDuty.
Catch problems sooner with IaC Scanning
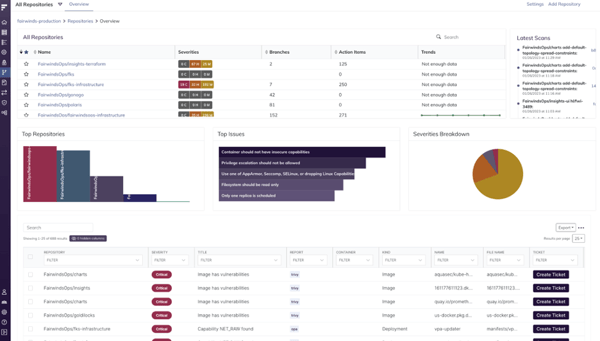
You can scan your Infrastructure-as-Code repositories using Fairwinds Insights by connecting it with a continuous integration platform. There are two ways to do that from the Repositories tab
-
Connect with GitHub — This is the easiest way to get started. Grant Insights access to specific repositories and we'll automatically scan every new pull request and commit.
-
Connect Manually — You’ll need to add a script to your existing CI/CD pipelines. We recommend this method if you're not using GitHub.
Share Findings with Your Team
Manage your team under Settings > Team Management. You can invite users to your new organization in Fairwinds Insights, assign them to a Team, assign a Role, and check the box to indicate whether they have Owner Access (access to add new users, manage teams, and delete the organization). They will receive an email inviting them to go through the same user registration process outlined in the earlier section, but they will be part of your organization.
You can also create a new team and configure team access to clusters, namespaces and repositories. Alternatively, you can block access to specific clusters, namespaces, and repositories. Set that up and click Create Team.
Try Out Fairwinds Insights
These are your basic first steps to getting started on Fairwinds Insights Free Tier! There’s a lot you can discover about your Kubernetes clusters and workspaces using Fairwinds Insights, so try out the different capabilities. Find vulnerabilities, improve your efficiency, and review compliance reports.
Let us know if you get stuck or have questions. And check out the Fairwinds Community Slack group, where you can ask questions and get answers from our team and the community alike. We’re looking forward to helping you put guardrails in place and make Kubernetes governance a reality for your team.

