K8s Tutorial: Use Polaris to Quickly Identify Kubernetes Security, Reliability and Efficiency Issues in Your Cluster
The Site Reliability Engineering team at Fairwinds has the unique experience of managing hundreds of Kubernetes clusters for a diverse set of companies, and they have found that clients often put resources into their clusters that cause their company to spend extra money on cloud costs, make their applications less available, and open their clusters to attack from malicious actors. As part of our efforts to help customers mitigate these issues, the Fairwinds software engineering team developed an automated way to check for these problems, and released the tool as the open source project called Polaris.
Polaris runs dozens of checks to ensure that your Kubernetes pods and controllers are configured using best practices in cluster security, efficiency and reliability. Polaris is a powerful tool because you can use it in three different ways. The first is as a dashboard to visualize issues with workloads currently running in your cluster. The second is as an admission controller, so you can automatically reject workloads that do not adhere to your organization's policies. The third is as a command-line tool, so you can test local YAML files on your computer, or as part of a CI/CD process.
In this tutorial, we will show you how to install Polaris and get started with each method.
Run Polaris in multiple clusters, track results over time and integrate with Slack, Datadog, and Jira with Fairwinds Insights, software to standardize and enforce development best practices. It's free to use! Compare Polaris and Insights.
Install and View the Polaris Dashboard
The Polaris dashboard is designed to let you visualize the problematic workloads already running inside your cluster.
In this tutorial, we show you how to install Polaris using Helm, the package management system for Kubernetes. If you prefer installing Polaris another way, it is possible to install it from the GitHub Releases page or with Homebrew.
To install Polaris with Helm, first, add the fairwinds-stable chart repository to your locally available Helm charts:
helm repo add fairwinds-stable https://charts.fairwinds.com/stableNext, create a Helm release called polaris in a new demo namespace:
helm upgrade --install polaris fairwinds-stable/polaris --namespace demo --create-namespaceIf your installation was successful, you can start the dashboard by port-forwarding the polaris-dashboard service:
kubectl port-forward --namespace demo svc/polaris-dashboard 8080:80Finally, view the Polaris dashboard by opening https://localhost:8080 in your browser.
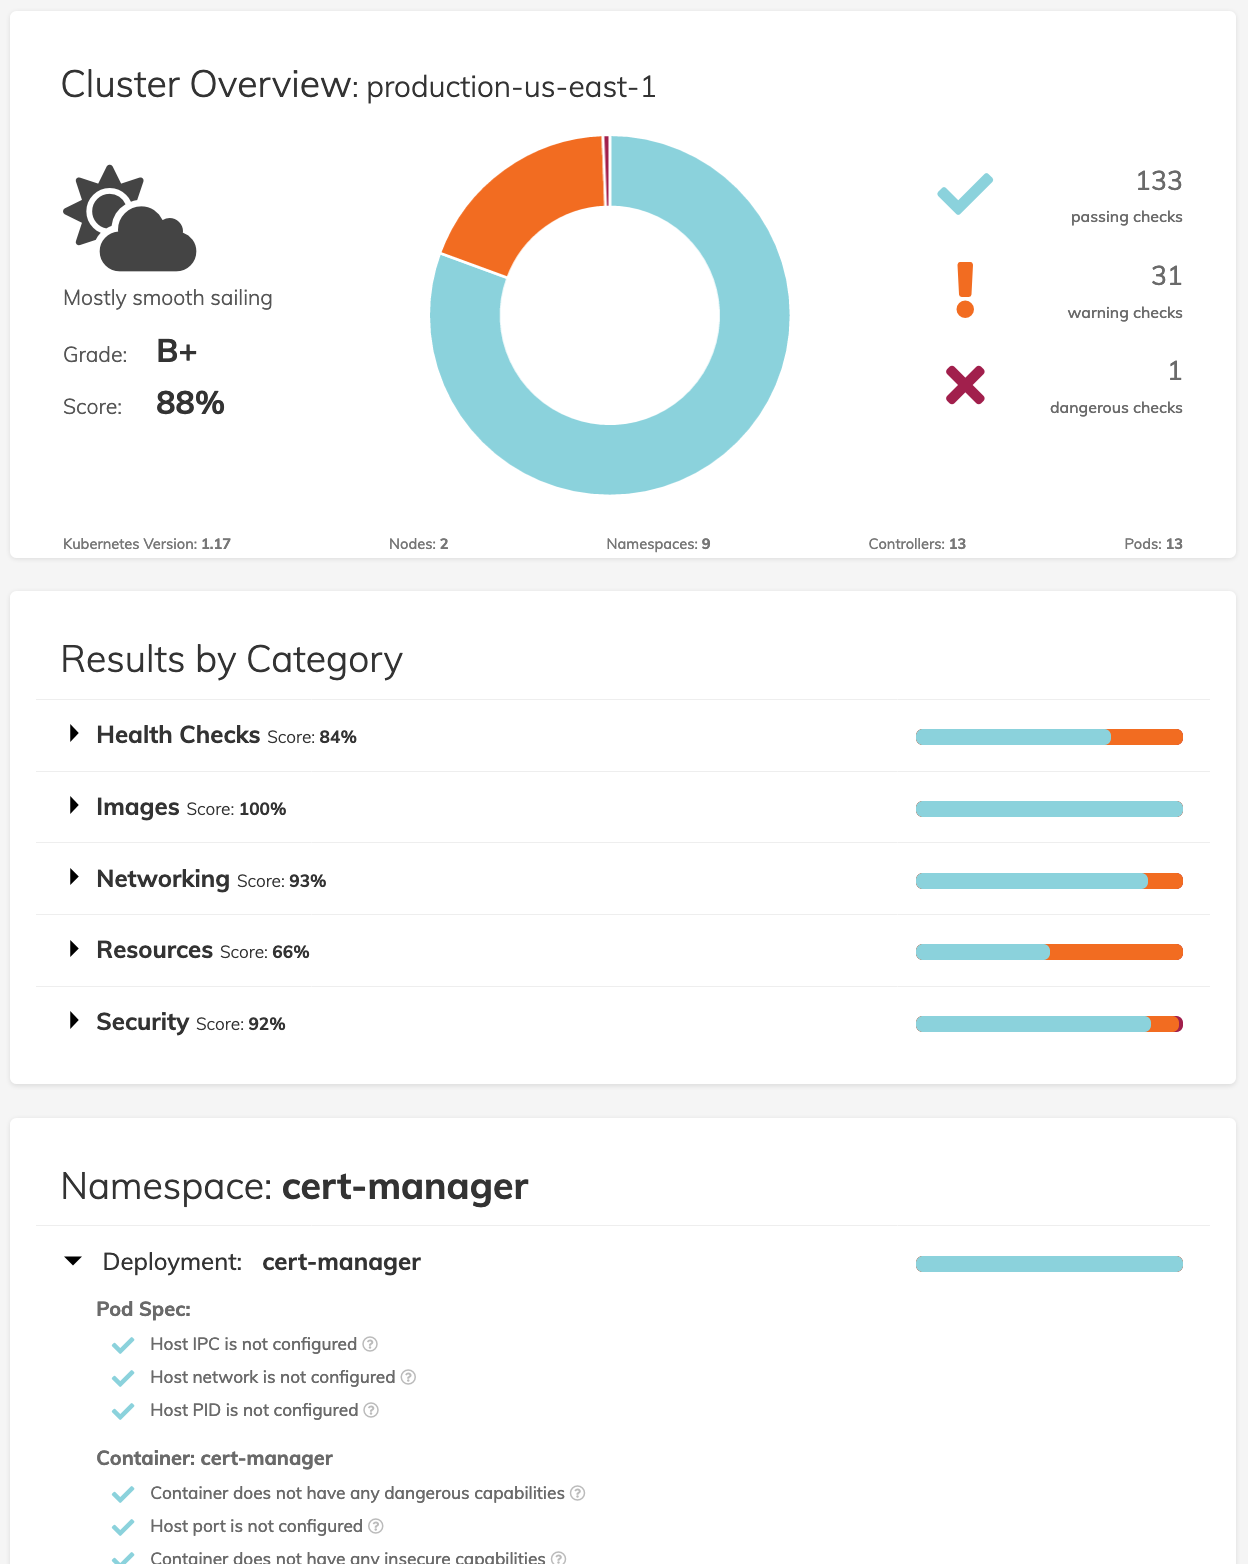
You will see the Polaris Dashboard with an overview of your cluster’s health including a letter grade, a score of the percentage of passing checks, and a weather report reflecting the status of your cluster from “storms ahead, be careful” to “smooth sailing.”

To dig into your results, you can view the just the checks marked as warning and dangerous checks, or view the results by namespace.
We will show you how to prioritize fixes in a future blog post.
Setup Polaris as a Kubernetes Admission Controller
Polaris can be configured to be an Admission Controller that will scan workloads you are trying to deploy, and reject any that do not conform to the Polaris standards for efficiency, reliability and security.
Like the instructions for installing the dashboard, this tutorial will show you how to use Helm to install Polaris and set it up as a validating webhook.
A valid TLS certificate is required for the Polaris Validating Webhook. If you have cert-manager installed in your cluster then the install methods below will work.
if you don't use cert-manager, you will need to:
-
Supply a CA Bundle with the webhook.caBundle
-
Create a TLS secret in your cluster with a valid certificate that uses that CA
-
Pass the name of that secret with the webhook.secretName parameter.
First, add the fairwinds-stable chart repository to your locally available Helm charts:
helm repo add fairwinds-stable https://charts.fairwinds.com/stableNext, create a Helm release called polaris in a new demo namespace, enable the webhook and disable the dashboard:
helm upgrade --install polaris fairwinds-stable/polaris --namespace demo --create-namespace --set webhook.enable=true --set dashboard.enable=falseIf the installation was successful, you will a message similar to this:
Release "polaris" does not exist. Installing it now.
NAME: polaris
LAST DEPLOYED: Thu Jul 28 19:56:21 2022
NAMESPACE: demo
STATUS: deployed
REVISION: 1
TEST SUITE: None
NOTES:
** Please be patient while the chart is being deployed **

Enjoy Polaris and smooth sailing!
To view the dashboard execute this command:

kubectl port-forward --namespace demo svc/polaris-dashboard 8080:80

Then open http://localhost:8080 in your browser.
Once the Polaris admission controller is enabled, when you try to deploy a workload that contains a danger-level issue, the validating webhook will prevent the deployment from being applied.
For example, if a developer tries to deploy a Helm release called basic-demo with no image tag, they will see an error message similar to this:
helm upgrade --install -n demo basic-demo fairwinds-incubator/basic-demo --create-namespace --set image.pullPolicy=IfNotPresent
Release "basic-demo" does not exist. Installing it now.

Error: admission webhook "polaris.fairwinds.com" denied the request:
Polaris prevented this deployment due to configuration problems:
- Container basic-demo: Image tag should be specified
When the developer adds an image tag and tries again to deploy the basic-demo release, the Polaris Validating Webhook will not interfere, and they will see a success message from Helm:
Release "basic-demo" has been upgraded. Happy Helming!
NAME: app
LAST DEPLOYED: Fri Jul 29 16:07:35 2022
NAMESPACE: demo
STATUS: deployed
REVISION: 2
TEST SUITE: None
NOTES:
1. Get the application URL by running these commands:
  export POD_NAME=$(kubectl get pods --namespace staging-app -l "app.kubernetes.io/name=basic-demo,app.kubernetes.io/instance=app" -o jsonpath="{.items[0].metadata.name}")
  echo "Visit http://127.0.0.1:8080 to use your application"
  kubectl port-forward $POD_NAME 8080:80
In a future blog post, we will describe how to set up mutating webhooks that automatically alter the deployments when an issue is found.
Audit Your Infrastructure as Code with the Polaris CLI Tool
The final way to use Polaris is to audit local Kubernetes manifests stored in YAML files using the command line tool. This is particularly helpful for running Polaris against your infrastructure-as-code as part of a CI/CD pipeline.
You can install Polaris using Homebrew, or from the Github Releases page.
First, visit the releases page and find the release that is right for your environment. For example, on a Linux machine with an amd64 processor, you will want to download the release for Linux amd64.
Run the following command to download and install Polaris:
curl -L "https://github.com/FairwindsOps/polaris/releases/download/7.0.1/polaris_linux_amd64.tar.gz" > polaris.tar.gz
tar -xvf polaris.tar.gz
sudo mv polaris /usr/local/bin/
It is possible to use Polaris to audit Kubernetes yaml manifests on your computer. For example, if you want to scan manifests in a directory named deploy, run the command:
polaris audit --audit-path ./deploy/ --format=prettyPolaris will display a score and show you success, warnings and danger-level issues similar to this:
Polaris audited Path ./deploy/ at 2022-07-29T16:40:08-05:00
    Nodes: 0 | Namespaces: 0 | Controllers: 1
    Final score: 55

Deployment kube-info-deployment in namespace demo
    deploymentMissingReplicas            🎉 Success
        Reliability - Multiple replicas are scheduled
    hostIPCSet                           🎉 Success
        Security - Host IPC is not configured
    hostNetworkSet                       🎉 Success
        Security - Host network is not configured
    hostPIDSet                           🎉 Success
        Security - Host PID is not configured
  Container kube-info
    runAsPrivileged                      🎉 Success
        Security - Not running as privileged
    cpuLimitsMissing                     😬 Warning
        Efficiency - CPU limits should be set
    livenessProbeMissing                 😬 Warning
        Reliability - Liveness probe should be configured
    memoryLimitsMissing                  😬 Warning
        Efficiency - Memory limits should be set
    memoryRequestsMissing                😬 Warning
        Efficiency - Memory requests should be set
    privilegeEscalationAllowed           ❌ Danger
        Security - Privilege escalation should not be allowed
    readinessProbeMissing                😬 Warning
        Reliability - Readiness probe should be configured
    tagNotSpecified                      🎉 Success
        Reliability - Image tag is specified
    insecureCapabilities                 😬 Warning
        Security - Container should not have insecure capabilities
    runAsRootAllowed                     ❌ Danger
        Security - Should not be allowed to run as root
    cpuRequestsMissing                   😬 Warning
        Efficiency - CPU requests should be set
    dangerousCapabilities                🎉 Success
        Security - Container does not have any dangerous capabilities
    hostPortSet                          🎉 Success
        Security - Host port is not configured
    notReadOnlyRootFilesystem            😬 Warning
        Security - Filesystem should be read only
    pullPolicyNotAlways                  😬 Warning
        Reliability - Image pull policy should be "Always"
Polaris can also audit the workloads in an existing cluster. Make sure you have your KUBECONFIG file setup and then run the command
polaris audit --format=prettyIn a future post, we will show you how to use Polaris in a CI/CD pipeline.
Use Polaris to Audit Multiple Clusters at Once
If you have multiple clusters and want to use Polaris to scan them all at once, Fairwinds offers a platform called Insights. Users can centrally manage Polaris across clusters consistently to make sure your Kubernetes workloads are as efficient, reliable and secure as they can be.
Resources
-
Learn more about Polaris


