Kubernetes HPA Autoscaling with Custom and External Metrics - Using GKE and Stackdriver Metrics
Kubernetes deployment autoscaling is more exciting since HorizontalPodAutoscaler can scale on custom and external metrics instead of simply CPU and memory like before.
In this post, I will go over how HPAs work, whats up with the custom and external metric API, and then go through an example where I configure Kubernetes deployment autoscaling an application based on external Nginx metrics.
Background
How the Horizontal Pod Autoscaler Works
HPAs are implemented as a control loop. This loop makes a request to the metrics api to get stats on current pod metrics every 30 seconds. Then it calculates if the current pod metrics exceed any of it’s target values. If so, it increases the number of deployment objects. I think this doc on the autoscaler’s autoscaling algorithm is a great read.
Essentially the HPA controller get metrics from three different APIs: metrics.k8s.io,custom.metrics.k8s.io, and external.metrics.k8s.io.Kubernetes is awesome because you can extend its API and that is how these metric APIs are designed. The resource metrics, the metrics.k8s.io API, is implemented by the metrics-server. For custom and external metrics, the API is implemented by a 3rd party vendor or you can write your own. Currently I know of the prometheus adapter and custom stackdriver adapter that both implement custom and external metrics API. Check out these k8s docs on the topic for details.
Example of Scaling Based on External Metrics
Here is an example I created that scales a Kubernetes deployment running on a GKE cluster with metrics from Stackdriver. However, I do not use the metrics that Stackdriver has by default, but rather I ship external metrics from Nginx metrics into Stackdriver, then use those metrics to scale my app. Below I describe the steps I took to accomplish this. This repo has example code for this.
Setup steps:
- Create a GKE cluster (> v1.10)
- Enable Stackdriver monitoring (create stackdriver account)
My goal is to add a horizontal pod autoscaler that will scale my deployment based on a Nginx external metrics that the HPA gets from Stackdriver.
Here are the high-level steps I took to accomplish this:
- Confirm the metric server is running in the Kubernetes cluster.
- Deploy the External Metric server that implements custom and external metrics API.
- Deploy an Nginx ingress controller with a sidecar pod that will scrape prometheus-formatted metrics from nginx and send them to stackdriver.
- Deploy my application with an HPA that scales the deployment based on the nginx metrics.
References:
- GCP docs Autoscaling Deployments with External Metrics
- GCP docs Autoscaling Deployments with Custom Metrics
- My example repo
Here are more detailed version of those same steps:
- 1. Make sure metric server is running in the Kubernetes cluster. In GKE, metric server is launched by default. Otherwise, metric service can be launched by following the info on Metric Server readme or use the metric server helm chart.
# check if the metric server is deployed (or heapster if before v1.11)
$ kubectl get deploy --all-namespaces
[...deleted...]
kube-system   metrics-server-v0.2.1                 1         1
kube-system   heapster-v1.5.3                       1         1
# make a request to the metrics api to show that its available
$ kubectl get --raw "/apis/metrics.k8s.io/" | jq
{
  "kind": "APIGroup",
  "apiVersion": "v1",
  "name": "metrics.k8s.io",
  "versions": [
    {
      "groupVersion": "metrics.k8s.io/v1beta1",
      "version": "v1beta1"
    }
  ],
  "preferredVersion": {
    "groupVersion": "metrics.k8s.io/v1beta1",
    "version": "v1beta1"
  },
  "serverAddressByClientCIDRs": null
}
You can see that the external metrics API and the custom metric API are not available yet.
$ kubectl get --raw "/apis/custom.metrics.k8s.io/v1beta1" | jq
Error from server (NotFound): the server could not find the requested resource
$ kubectl get --raw "/apis/external.metrics.k8s.io/v1beta1"
Error from server (NotFound): the server could not find the requested resource
Lets fix that.
- 2. Deploy the External Metric server. Here I use the stackdriver adapter, but alternatively there is the Prometheus Adapter too. The Custom Metrics Stackdriver Adapter is an implementation of Custom Metrics API and External Metrics API using Stackdriver as a backend. This service makes stackdriver metrics available at a k8s API endpoint.
Following the steps from the google docs, I deployed the stackdriver adapter:
$ kubectl create clusterrolebinding cluster-admin-binding \
 --clusterrole cluster-admin \
 --user "$(gcloud config get-value avvount)"
clusterrolebinding.rbac.authorization.k8s.io/cluster-admin-binding created

$ kubectl create -f
https://raw.githubusercontent.com/GoogleCloudPlatform/k8s-stackdriver/master/custom-metrics-stackdriver-adapter/deploy/production/adapter.yaml
# confirm it deployed happily
$ kubectl get po --all-namespaces
custom-metrics custom-metrics-stackdriver-adapter-c4d98dc54-xq8bj 1/1 Running 0 51s
Check that the Stackdriver deployment was successful and that the custom and external metric APIs are now available:
# confirm it deployed happily
$ kubectl get po --all-namespaces
custom-metrics custom-metrics-stackdriver-adapter-c4d98dc54-xq8bj 1/1 Running 0 51s
# check to see if custom/external metrics api is up now
$ kubectl get --raw "/apis/external.metrics.k8s.io/v1beta1" | jq
{
 "kind": "APIResourceList",
 "apiVersion": "v1",
 "groupVersion": "external.metrics.k8s.io/v1beta1",
 "resources": []
}
$ kubectl get --raw "/apis/custom.metrics.k8s.io/v1beta1" | jq
{
 "kind": "APIResourceList",
 "apiVersion": "v1",
 "groupVersion": "custom.metrics.k8s.io/v1beta1",
 "resources": [
 {
 "name": "*/agent.googleapis.com|agent|api_request_count",
 "singularName": "",
 "namespaced": true,
 "kind": "MetricValueList",
 "verbs": [
 "get"
 ]
 },
[...lots more metrics...]
 {
 "name": "*/vpn.googleapis.com|tunnel_established",
 "singularName": "",
 "namespaced": true,
 "kind": "MetricValueList",
 "verbs": [
 "get"
 ]
 }
 ]
}
That's pretty cool how many custom metrics are available for use. However, I want to use an external metric from Nginx metrics. So I need to get nginx setup to send its metrics to stackdriver so that those will be available as well.
- 3. I deployed Nginx ingress controller with the official helm chart. Then configured Nginx Ingress Controller to send its metrics to stackdriver. Luckily, Nginx Ingress controller already has a route
/metricsat port10254that exposes a bunch of metrics in prometheus format ( here is an examplecurlrequest to the nginx metrics endpoint to see a list of what metrics are exposed).
Also, stackdriver supports uploading additional metrics in prometheus format. In order to do this, I deployed the prometheus-to-stackdriver sidecar with the Nginx Ingress Controller deployment. This sidecar scrapes metrics and sends them to stackdriver.
Using this example of how to create the sidecar, I added this prometheus-to-sd container to the nginx-ingress-controller deployment, configuring the — source with the port and route of the metrics:
- name: prometheus-to-sd
  image: gcr.io/google-containers/prometheus-to-sd:v0.2.1
  ports:
    - name: profiler
      containerPort: 6060
  command:
    - /monitor
    - --stackdriver-prefix=custom.googleapis.com
    - --source=nginx-ingress-controller:http://localhost:10254/metrics
    - --pod-id=$(POD_NAME)
    - --namespace-id=$(POD_NAMESPACE)
  env:
    - name: POD_NAME
      valueFrom:
        fieldRef:
          fieldPath: metadata.name
    - name: POD_NAMESPACE
      valueFrom:
        fieldRef:
          fieldPath: metadata.namespace
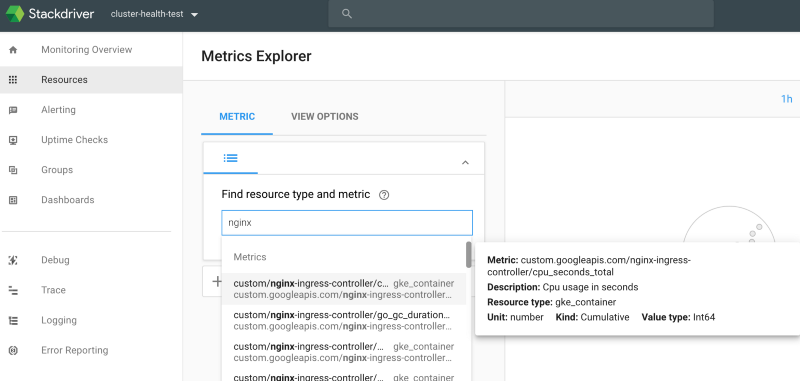
I could check now that the nginx external metrics we available in Stackdriver by navigating to the Stackdriver metrics dashboard:

Also I could check that the nginx metrics are now available at the kubernetes external metric api endpoint now. For example, I can retrieve the value of nginx_connections_total.
$ kubectl get --raw "/apis/external.metrics.k8s.io/v1beta1/namespaces/default/custom.googleapis.com|nginx-ingress-controller|nginx_connections_total" | jq
{
 "kind": "ExternalMetricValueList",
 "apiVersion": "external.metrics.k8s.io/v1beta1",
 "metadata": {
     "selfLink": "/apis/external.metrics.k8s.io/v1beta1/namespaces/default/custom.googleapis.com%7Cnginx-ingress-controller%7Cnginx_connections_total"
     },
 "items": [
[...removed...]
     {
     "metricName": "custom.googleapis.com|nginx-ingress-controller|nginx_connections_total",
     "metricLabels": {
         "metric.labels.ingress_class": "nginx",
         "metric.labels.namespace": "",
         "metric.labels.state": "active",
         "resource.labels.cluster_name": "example-custom-metrics",
         "resource.labels.container_name": "",
         "resource.labels.instance_id": "gke-example-custom-metri-default-pool-43d79fe3-08rp.c.cluster-health-test.internal",
         "resource.labels.namespace_id": "default",
         "resource.labels.pod_id": "nginx-nginx-ingress-controller-df8dd967f-fvcx9",
         "resource.labels.project_id": "cluster-health-test",
         "resource.labels.zone": "us-central1-a",
         "resource.type": "gke_container"
     },
     "timestamp": "2018-07-22T21:22:48Z",
     "value": "0"
 },
[...removed...]
 ]
}
- 4. Here is an example helm chart of a sample nodejs app I deployed. Now that the external and custom metrics are available to use, I can create the horizontal pod autoscaler to scale my example nodejs application based on any of the nginx metrics. For example, lets say I wanted to scale up the app when there were more than one active connections to nginx. I can create an HPA that will increase the replica count of the Deployment
example-nodejs-appwhen the metricnginx_connections_totalincrease beyond the targetValue of 1.
# hpa.yaml
apiVersion: autoscaling/v2beta1
kind: HorizontalPodAutoscaler
metadata:
 name: example-hpa-external-metrics
spec:
 minReplicas: 1
 maxReplicas: 5
 metrics:
 - type: External
     external:
         metricName:  custom.googleapis.com|nginx-ingress-internal-controller|nginx_connections_total
         targetValue: 1
     scaleTargetRef:
         apiVersion: apps/v1
         kind: Deployment
         name: example-nodejs-app
The HPA shows there is one current connection to nginx, so the replica count is 1. If the nginx connection increases, so will the pod replicas. While scaling on nginx connection counts may not be the best metric to scale on, its a pretty cool example of how all this works.
$ kubectl describe hpa example-hpa-external-metrics
Name: example-hpa-external-metrics
Namespace: default
Reference: Deployment/example-nodejs-app
Metrics:
"custom.googleapis.com|nginx-ingress_controller|nginx_connections_total"
(target value): 1/ 1
Min replicas: 1
Max replicas: 5
Deployment pods: 1 current / 1 desired
Conditions:
 Type Status Reason Message
 ---- ------ ------ -------
 AbleToScale True ReadyForNewScale the last scale time was sufficiently old as to warrant a new scale
 ScalingActive True ValidMetricFound the HPA was able to successfully calculate a replica count from external metric custom.googleapis.com|nginx-ingress-controller|nginx_connections_total(nil)

 ScalingLimited False DesiredWithinRange the desired count is within the acceptable range
Events: <none>
Resources:
- Kubernetes HPA docs
- Jetstack Blog on metrics APIs
- my github with an example app and helm chart


